R
Data Profiling Report
data, and the capability to extract useful knowledge from data, should be regarded as key strategic assets.
“Data scientists spend about 80% of their time cleaning and organizing the data”
Un ensemble de données doit être organisés de telle sorte que chaque variable soit une colonne et chaque observation (ou cas) une ligne (see tidy).
Les données ordonnées facilitent l’analyse: Souvent les données ne sont pas accessibles, ou bien elles sont exportées ou mis à disposition dans un format non exploitable.
Produire un prototype de dashboard, c’est :
Comment lire de multiples classeurs xlsx et les convertir en multiples fichiers .csv ? Lire de multiples classeurs xlsx
library(readxl)
list <- import_list("~/myfile.xlsx")
setwd("~/_datas/")
list <- lapply(list, as.data.frame)
N <- names(list)
Convertir en multiples fichiers .csv et sauvegarder dans des fichiers séparés dans le répertoire précédement créé ~/_datas/
for (i in N) {
  filename = paste0(i, "all", ".csv")
  write.csv(list[[i]], filename)
}
downloader des fichiers .csv et les explorer
#Load  library to bring in the dataset
library(readr)
library(dplyr)
library(DataExplorer)

#Download the data set

df= read_csv('https://www.covid19.admin.ch/api/data/20210726-q8s6zrsp/sources/COVID19FullyVaccPersons_vaccine_v2.csv', col_names = TRUE)
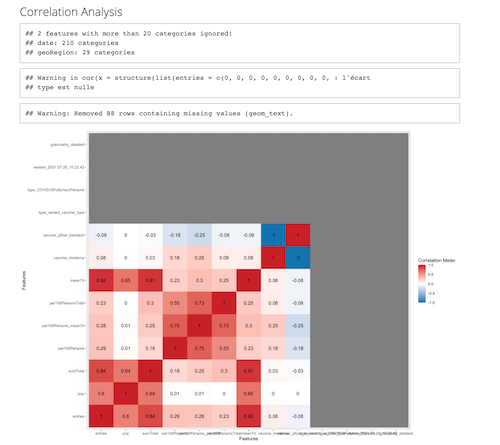
Explorer les datas: QQ analyse, Correlation Analysis, Principal Component Analysis
glimpse(df)
summary(df)
DataExplorer::create_report(df)