R
Simple interactive visualisation
Un graphique interactif permet à l’utilisateur d’effectuer des actions : zoomer, survoler un marqueur pour obtenir une info-bulle, choisir une variable à afficher, etc. R offre un ensemble de paquets html qui permettent de construire des visualisations simples interactives.
Ici un exemple de mise en oeuvre, depuis l’extraction des données en ligne, la transformation, la visualisation, et l’exportation sous forme d’un fichier .html.
- par exemple pour un suivi quotidien des évolution de pandémie
- ou pour voir les KPI’s d’un site
https://covid.ourworldindata.org/data/owid-covid-data.csv
Extract - Transform - Plot Data & dynamicTicks
Times < 1mn Lines < 40
library(ggplot2)
library(utility)
library(plotly)
library(hrbrthemes)
date <- Sys.Date()
##Extract##
data2 <- read.csv(
"https://covid.ourworldindata.org/data/owid-covid-data.csv",
na.strings = "",
fileEncoding = "UTF-8-BOM")
##Transform##
Gruppen2 <- filter(data2,
location == c("Switzerland", "France", "Sweden", "Germany" , "Italy"))
Gruppen2$date <- as.Date.factor(Gruppen2$date, format = "%Y-%m-%d")
dd <- Gruppen2[(Gruppen2$date > "2020-01-01"), ]
##Plot##
p3 <- ggplot(dd,
aes(x = date, y = new_cases_smoothed_per_million, color = location)) +
geom_line () +
theme_ipsum() +
labs(
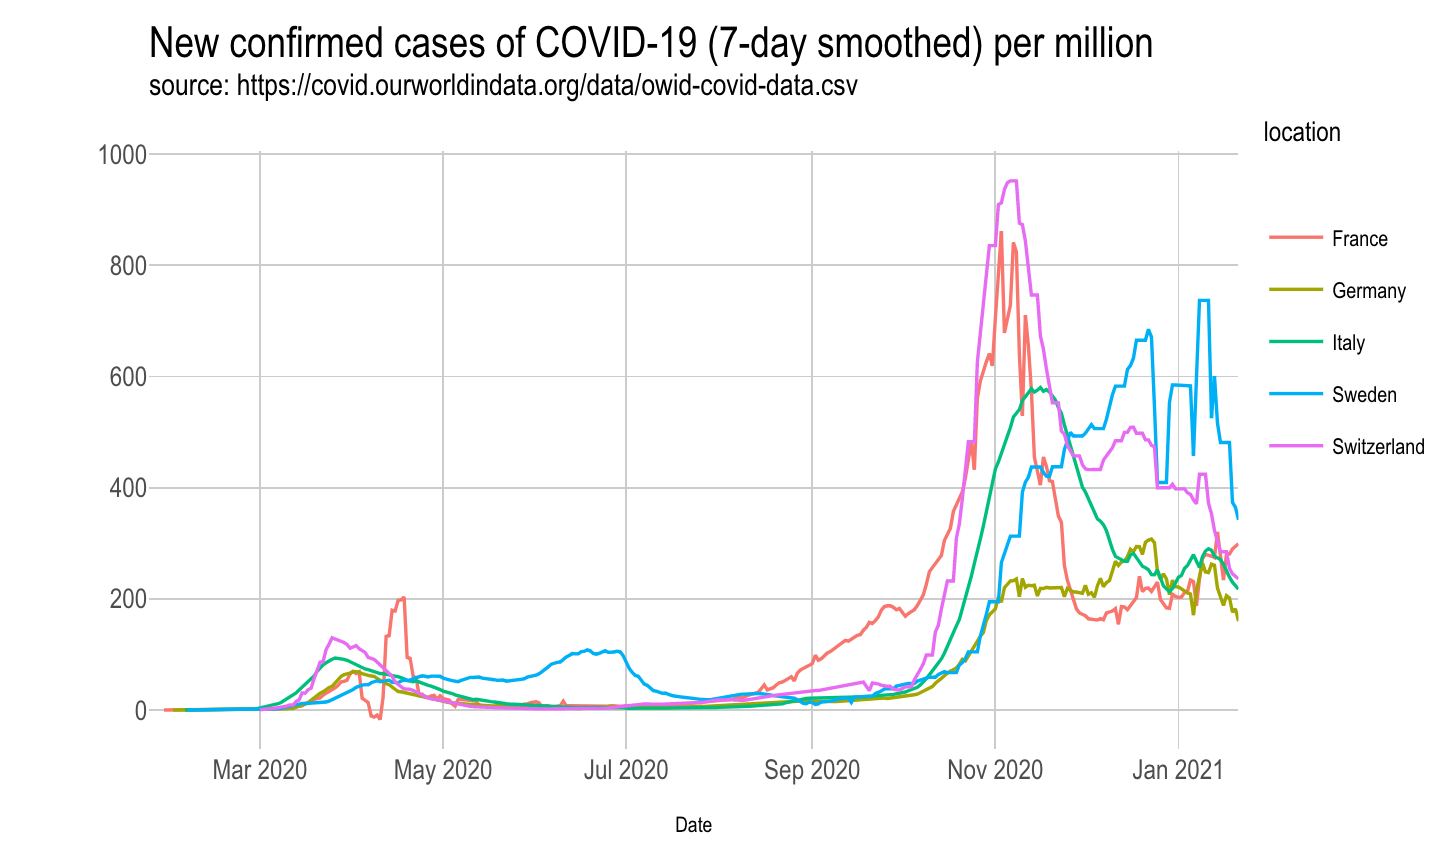
title = "New confirmed cases of COVID-19 (7-day smoothed) per million",
subtitle = "source: https://covid.ourworldindata.org/data/owid-covid-data.csv",
caption = "Data Repository by the Center for Systems Science and Engineering (CSSE) at Johns Hopkins University ",
x = "Date",
y = "")
##Plot Data & dynamicTicks##
ggplotly(p3, dynamicTicks = TRUE) %>%
layout(title = list(
text = paste0(
'New confirmed cases of COVID-19` `(7-day smoothed) per million',
'<br>',
'<sup>',
'source: https://covid.ourworldindata.org/data/owid-covid-data.csv',
'</sup>'
)
))